So… you’ve been running Facebook Video ads and you do not understand which ads are performing well, and…
So… you’ve been running Facebook Video ads and you do not understand which ads are performing well, and which ads are not eh?
You look at the numbers and you can’t tell whether to hit the pay button or turn them off.
Well, you’re not alone. Thousands of so-called Facebook marketers are doing the same thing.
In this article, you’ll learn the 9 step process that Dennis Yu from Blitz Metrics used to see if their ads are running well. They have spent over a billion dollars on Facebook ads so when they speak I listen.
If you have ever talked to me about my local SEO strategy, I have always said my secret sauce is Facebook Ads.
Whenever I had a problem ranking a client, I would always run Facebook ads to get the search engine ranking to go up in my favor.
Well now, I am saying it is a requirement. You need to be running Facebook ads and SEO if you are a small business. I would dare say if you could only Focus on one I would recommend you start with Facebook first.
Yes, the local SEO guy said to run Facebook ads before any SEO optimizations. Why because the Facebook ads you run will help your SEO, anyway. That is why I run FB ads.
I went through a course taught by Logan Young over at Blitz Metrics. They call it the Standards of Excellence. This course goes over every metric you need to know to understand your Facebook campaigns.
Here is the 9 things you need to know if you are ads are performing well.
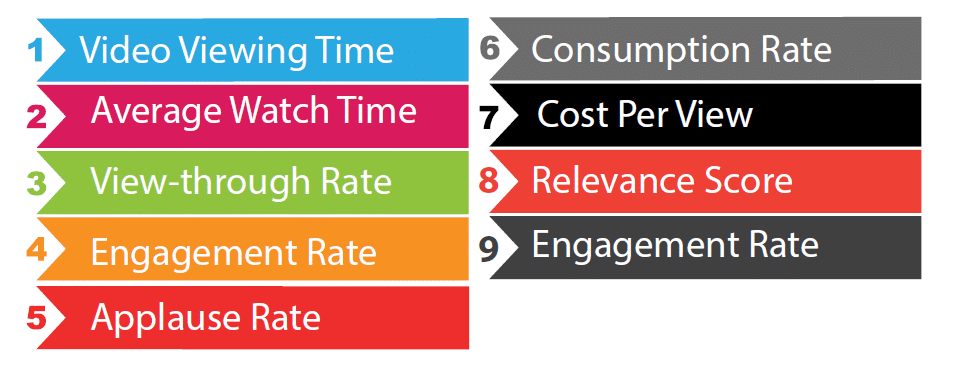
1&2 Video Viewing Time and Average Watch time
Seems simple enough right? Well according to Facebook the average viewing time of a Facebook video is 6 seconds. Facebook will count video views as low as 3 seconds. If you are running a video ad you want you to want your view length to be at least 10 seconds. Here is a break down of the Standard of Excellence for video view length.
View Length
> 3 seconds | Poor
6 Seconds | Average
10 Seconds | Good
15-20 Seconds | Great
30+ Seconds | Excellent – This is Your UNICORN
We did our own test video for 5 days to see what numbers we could get when we ran our Facebook Video. Our test video got an average watch time of 22 seconds.
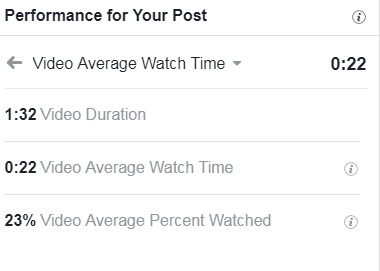
Yes I was excited when I saw we had an amazing watch time and we were close to unicorn status. Keep in mind we only ran this ad for 5 days and the watch time will go down over time but it is a great start and we are on the right path.
But check out how many minutes people watched my video. They watched for 111 minutes. Crazy if you think about it. Spent five dollars and people watched for over 2 hours. Powerful if you are a small business.

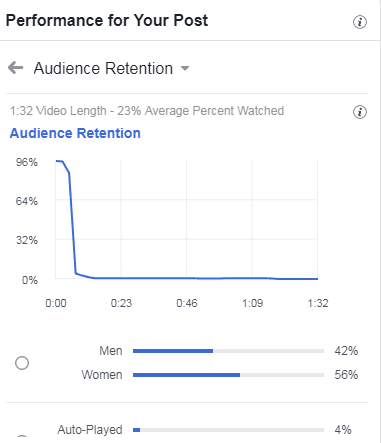
This is a screenshot showing audience retention. I was surprised to see that only 4% of the videos were auto-played and 96% percent were clicked to play. 52 people watched 95% to 100% of the video. I didn’t spend a lot of time on this video so I was surprised to find that people were engaged enough to watch the whole video.
3. View-through Rate
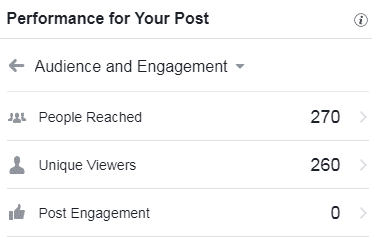
Facebook doesn’t give you a View-through rate (VTR) you have to calculate it yourself. Luckily it is easy to do. All you have to do is divide Unique Viewers by People Reached and you will get your View-through Rate.
The average VTR on Facebook is 30%. So if your video was seen by 1,000 people 300 was counted as an actual view by Facebook. So we are looking for your VTR to be at least 30%. Anything higher than that and you are doing well.
Our VTR was out of this world on this video. Our View-through rate was 96%. Again we only ran the video for 5 days and this number will go down but this is a great sign we have a winning video. Check the stats below:
4. Engagement
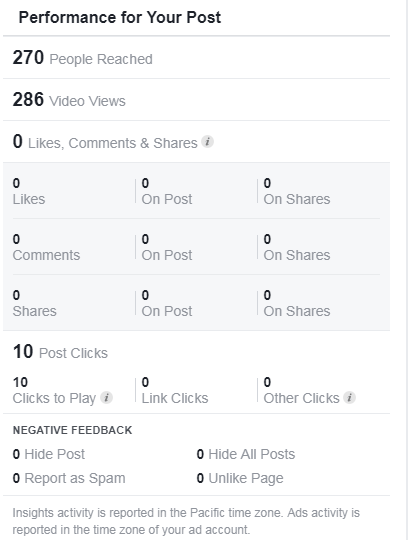
The people that liked commented and shared this make up your engagement number. The average engagement is 3%. You are shooting for an engagement number of at least 10% to be considered a winning video post. On this metric, our video was lost. Even though we met all the standards of excellence on the first 3 metrics we got little engagement on our post.
We didn’t get any likes or shares. We got 10 post clicks. This could be due to our targeting. We targeted men and women 25 – 65 in Arizona only. Again it also might be too early to tell.
5 & 6 Applause Rate and Consumption Rate
The Applause rate is interactions the public can see like when someone likes, comments, and shares on your post. Consumption Rate is all the non-public engagement no one can see but you like video video views and clicks. You find these stats inside of Facebook insights.
For local businesses we care about the about the Applause rate. Is the public liking sharing and sharing what you are putting out there? Again we like to see this at 10% you have a winning video.
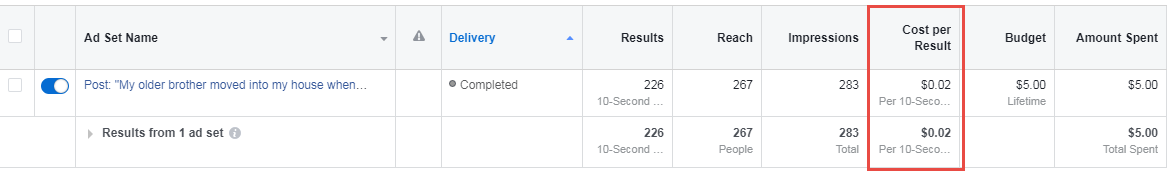
7. Cost Per View
Cost per view is how much money you spent divided by how many video views you got. You want to be around.02 on this. This is one of those stats than can get you into trouble.
Don’t put too much stock into this metric. It is all relative. If you are a plumber and your cost per view is 10 cents and you are getting new customers, then you will keep running the video.
But on the flip side, you could be getting.001 a view and getting no new customers. So you always have to look at the big picture to see if the cost per view makes sense to your business.
8. Relevance Score
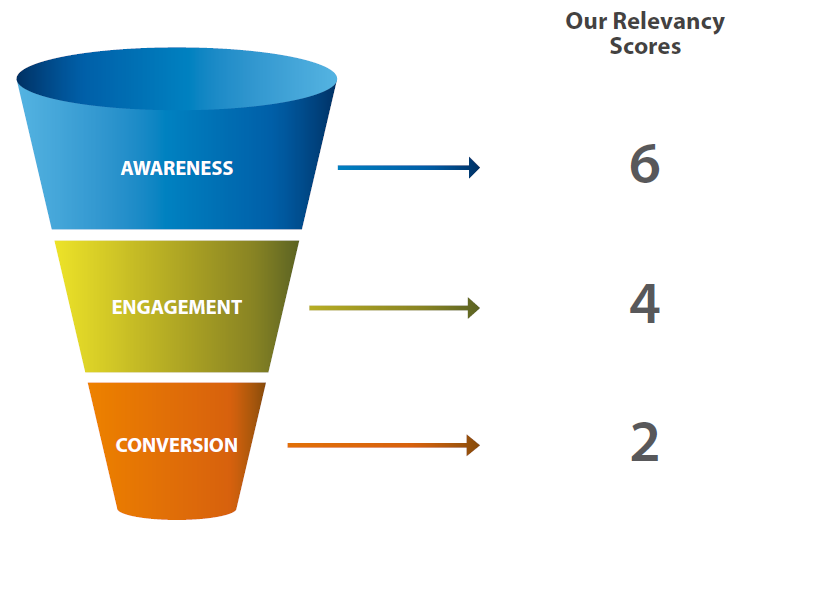
The relevance score is a score from 1 to 10 with 10 being the highest. At different stages of the funnel, you should have a certain Relevance score. The video I was running was considered a why video. You can learn more about why videos are here. This video is a top-of-funnel video to gain awareness. So my video should have a relevance score of at least 6.
Facebook didn’t give us a relevance score but I am sure it was around a 7 or 8. Here is the Standards of Excellence for Relevance Scores depending on what type of ad you running whether it is for Awareness Engagement or conversion..
If you want to learn more about Dennis Yu 3×3 video strategy click here. You can also see Logan’s $1 dollar for a day course. I just saw Dennis Speak at Digital Marketer’s headquarters, and he now says you should spend at least $2 dollars a day on your video ads.
9. Burn-Out Rate
Your video will burn out and your audience will tire of it. But don’t think that will happen soon. With the dollar-a-day strategy your video can live for years. You want to make sure that your frequency is not over 2 per week per ad set. If it is, your video might reach your audience too often and people will get upset and flag your video.
Conclusion
The video we ran for the five days has the potential to be great. With a little more work better lighting looking in the camera and keeping the video closer to a minute will help the video even more.
Let me know what you think. Please comment below.
Antoine is a Local Seo expert that has personally optimized over 7,000 Google My Business listings. With over 15 years of experience he has created the 3F Flywheel Formula for local businesses. Antoine has worked as a Local Seo Director for one of the largest Fortune 500 digital marketing agencies. Before Antoine was in digital marketing he played professional baseball for the Chicago Cubs. Antoine lives in southern California and writes about local seo on his blog. LearnLocalSeo.com
Antoine, this is such a fantastic breakdown of BlitzMetrics’ Standards of Excellence. Love that you had a 22 second average watch time. Looking forward to you knocking it out of the park with our $1 a Day Strategy over time.